It’s the end of 2019.
You know what you know now about the pandemic, inflation, the war, and volatile markets.
You’re asked to predict market returns over the next three years.
What do you say?
Alan Abelson was a veteran financial journalist, and longtime writer of the influential Up and Down Wall Street column in Barron's Magazine.
This was his take on market movements:
"Do you know what investing for the long run, but listening to market news everyday, is like? It's like a man walking up a big hill with a yo-yo and keeping his eyes fixed on the yo-yo instead of the hill."
It's unlikely you'd have thought markets would be up 25% given so much uncertainty since 2020.
But that's what happened.
The chart below from Dimensional shows the growth of £1 invested in the S&P 500 from 1 January, 2020 to December 31, 2022.
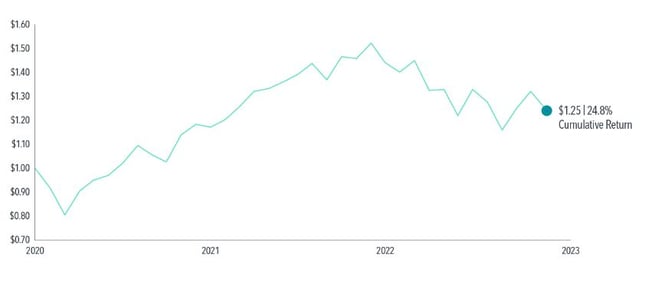
The market was up almost 25%.
And that includes last year’s 19% decline.
Too often, investors ignore the big picture, looking only at year-by-year returns and not the total history of returns.
Almost a century of evidence
Let's look back a little further.
Dimensional now has 97 years of data on stock returns.
This chart shows the distribution of annual returns over that time period, ranging from a year when the market lost almost 50% (far left), to two years when it gained more than 50% (far right).
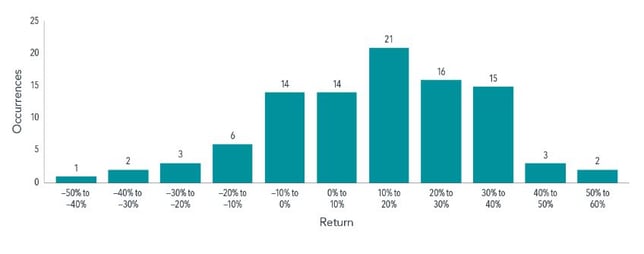
The bulk of the returns are between –10% and +40%.
When you look at data like this, you get a sense of the distribution of returns, rather than a forecast of what any year’s return will be.
The best prediction of what will happen next year is a random draw from one of these 97 years.
Let's hop back to the most recent 3 years.
The returns from 2020 and 2021 were positive, with 2022 negative:
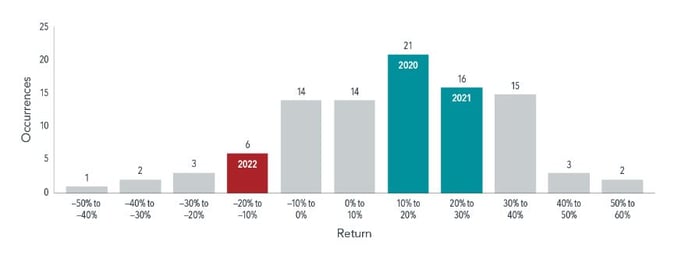
Two positive years and one negative.
Two steps forward and one back.
Sometimes, that's the way the world works.
But how do we explain the stock returns of these last three years, given the stress that people have felt with the pandemic?
Human ingenuity strikes again
What happens when we, as companies or individuals, get hit with bad news?
We don’t just sit and take it—we try to figure out how to get back on track.
That’s what happened here.
The pandemic hit and markets dropped 20%.
But human ingenuity kicked in by the end of the year.
We had a vaccine and started distributing it at incredible speed.
That innovation continued into the next year.
In line with history
But how do the last 3 years compare with the previous 94?
The final chart shows the returns on the S&P 500 index and US Treasury bills over the last 97 years.
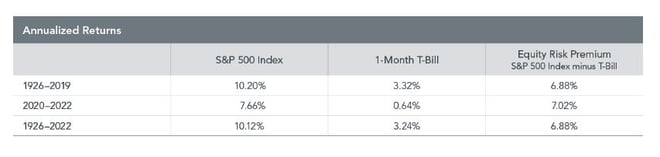
The first row is the 94-year time period of 1926–2019.
The S&P 500 index compounded at 10.2% per year.
Treasury bills, which we think of as being the riskless asset, compounded at 3.32%.
The difference between 10.2 and 3.32 is 6.88 percentage points.
This 7%, is the reward for taking the stock market risk.
The next row shows the last three years.
The S&P 500 compounded at 7.66%.
Treasury bills were basically flat (0.64%).
The difference between those two is also about 7%—7.02 percentage points.
So, for the last three years, the risk premium of 7% a year is almost precisely what it had been the previous 94.
In other words, the last three years in terms of equity returns have been "normal."
How can we explain "normal" returns when it seemed the world was falling apart?
Public financial markets are a giant information-processing machine.
When bad news comes in, prices drop.
When good news comes in, prices rise.
The stock market every day is trying to set prices to induce investors to come in to invest.
If the stock market had a negative expected outcome, nobody would invest.
The stock market is constantly adjusting prices so that investors have a positive expected outcome.
One of the most important principles of investing is being a long-term investor with an investment plan you can stick with.
The stock market will go up and down.
It always has; it always will.
If during this three-year period you felt like you had to bail out of stocks for some reason, then you had probably invested too much in stocks to begin with.
But if you had about the right amount, for you, invested in stocks, there was a good chance that you didn’t have to make any adjustments to your portfolio mix.
What will happen over the next three years?
Who knows!
The good news is, if you’ve planned for the range of outcomes, you won’t have to worry about relying on a prediction.
Keep your eyes on the hill.